
Cognizant Artificial Intelligence Project
Advise one of Cognizant’s clients on a supply chain issue by applying knowledge of machine learning models


Welcome to the second simulation project offered by Forage. It is an advanced data job simulation created by Cognizant as part of the company’s virtual job experience.
Key components of the article include:
Company Profile
Project Background
Project Execution
Summarized Insights & Recommendations
P.S. If you are interested in reading the first simulations project, click 👉Lululemon Merchandising Project
Company Profile
Cognizant Technology Solutions is a professional service outfit specializing in providing technology and consulting services, and outsourcing services in the following markets: North America, Europe and International. The company’s product portfolio is focused on four segments: Financial Services, Health Sciences, Products and Resources, and Communications, Media and Technology.
Financial Services segments encompasses the following solutions: banking, capital markets, payments and insurance companies. Health Services solutions target the following categories: healthcare providers and payers, and life sciences companies, including pharmaceutical, biotech and medical device companies. Products and Resources solutions focus on manufacturers, automakers, retailers and travel and hospitality companies, as well as companies providing logistics, energy and utility services. Communications, Media and Technology solutions target global communications, media and entertainment, education, information services and technology companies.
Based on financials data for the fiscal year 2022, the total revenue earned by the company was $19.35 Billion, whereas net income earned in the same year was $2.13 Billion. The company has over 340 thousand employees.
Project Background
As part of Cognizant Digital Business, Cognizant’s Artificial Intelligence and Data Analytics Practice provides advanced data collection and management expertise, as well as artificial intelligence and analytics capabilities that help clients create highly personalized digital experiences, products and services at every touch point of the customer journey.
The company has on-boarded a new client Gala Groceries, (A technology-led grocery store chain based in the USA) who is experiencing a supply chain issue. Cognizant is required to help the client adopt an optimal solution using AI and data analytics.
The key goal of the project entails: Advise one of Cognizant’s clients on a supply chain issue by applying knowledge of machine learning models
Project Execution
As a junior data scientist, you will get the opportunity to step into the shoes of a Cognizant team member and complete tasks that replicate the work that Artificial Intelligence (AI) team does every day.
Key tasks you will perform include:
Exploratory Data Analysis
Data Modeling
Model Building and Interpretation
Machine Learning Production
Each of the above-highlighted tasks will be performed by you in collaboration with Cognizant’s AI team.
Exploratory Data Analysis
Task Background
Gala Groceries is a technology-led grocery store chain based in the USA. They rely heavily on new technologies, such as IoT to give them a competitive edge over other grocery stores.
They pride themselves on providing the best quality, fresh produce from locally sourced suppliers. However, this comes with many challenges to consistently deliver on this objective year-round.
Gala Groceries approached Cognizant to help them with a supply chain issue. Groceries are highly perishable items. If you overstock, you are wasting money on excessive storage and waste, but if you understock, then you risk losing customers. They want to know how to better stock the items that they sell.
This is a high-level business problem and will require you to dive into the data in order to formulate some questions and recommendations to the client about what else we need in order to answer that question.
Once you’re done with your analysis, we need you to summarize your findings and provide some suggestions as to what else we need in order to fulfill their business problem. Please draft an email containing this information to the Data Science team leader to review before we send it to the client.
Task’s Significance
The key lessons and skills derived from executing the task include:
How to explore a client’s sales data as part of the Data Science team
Using data exploration tools like Google Colab and Python
Framing a business problem as a data analytic problem
Communicating findings and recommendations to the relevant people in the data science team
Task Execution
Step 1:Prepare
First, you must download the CSV file provided within the additional resources (sample_sales_data.csv). This task will make use of coding notebooks, specifically using Python, which provide an interactive way of running and sharing code. There are 2 notebooks provided (eda.ipynb & eda_walkthrough.ipynb), “eda.ipynb” provides some code snippets to get started but will then assume that the user is able to use their knowledge to perform analysis on the data in Python.
Step 2: Exploration
Now that you’re ready to dive into the data, you should use the notebooks provided to conduct your exploratory data analysis. Try to use a rigorous and scientific approach when analyzing data. Always ask yourself this question: what do these results mean? You should aim to have a solid understanding of the statistical properties of the dataset when you’re complete (this may include the distributions of columns, descriptive statistics such as mean, median, max and min, etc.) By the end of the exploration, you should feel comfortable with the dataset and what it means. This should take you 25-30 minutes.
Step 3: Communication
Finally, you must summarize your findings in a concise and business-friendly manner within an email to the Data Science team leader. This email should also contain recommendations for what else we require in order to complete this task for the client. Please draft your email in a word document and submit this file for review. You can use the template provided in the additional resources section. This should take 5-10 minutes.
Task Output
Subject: Insights and Recommendations from Gala Groceries Sales Sample data EDA
Dear Professor X, Data Science Team Leader,
Based on the sample data provided for Gala groceries sales, I have conducted an exploratory data analysis investigating the question, “How to better stock the items that they sell?”
The outcome of the EDA entails:
Dataset contains approximately 7,800 unique observations and 9 key features (columns)
Majority of consumers (About 26%) use cash as forms of payment
Non-member customers represent the largest category of customers, leading by a margin of 20.5%
Fruit and vegetables were the two most purchased items
In terms of distribution of values: Majority of the values in total column are concentrated on the left side of the histogram. This means that total value of products bought by customers are in the lower ranges
Based on type and strength of correlation between variables/features in the dataset, as the unit price or quantity of an item increases, the total price of the item also tends to increase
Conversely, as the unit price of an item increases, the quantity of the item that is sold tends to decrease
Next steps:
Acquire Inventory Data: Real-time data on current stock levels and the rate at which items are selling.
Acquire Supplier Information: Details about the suppliers, their capacity, and delivery schedules.
Ascertain the demand cycle of the grocery's products: Is the demand fluctuation based on seasons, consumer trends, etc
Supplement the current sample size of historical data
Recommendations:
Acquire the needed data outlined in Next steps
Recommend adoption of optimal predictive analytics solutions based on narrowed down business problem like predict the demand of products on an hourly basis in order to procure products more intelligently
Best regards,
Collins Ogombo, Junior Data Scientist
Data Modeling
Task Background
Your work on the previous task was very helpful to propel this project forward with the client. Based on your recommendations, they want to focus on the following problem statement:
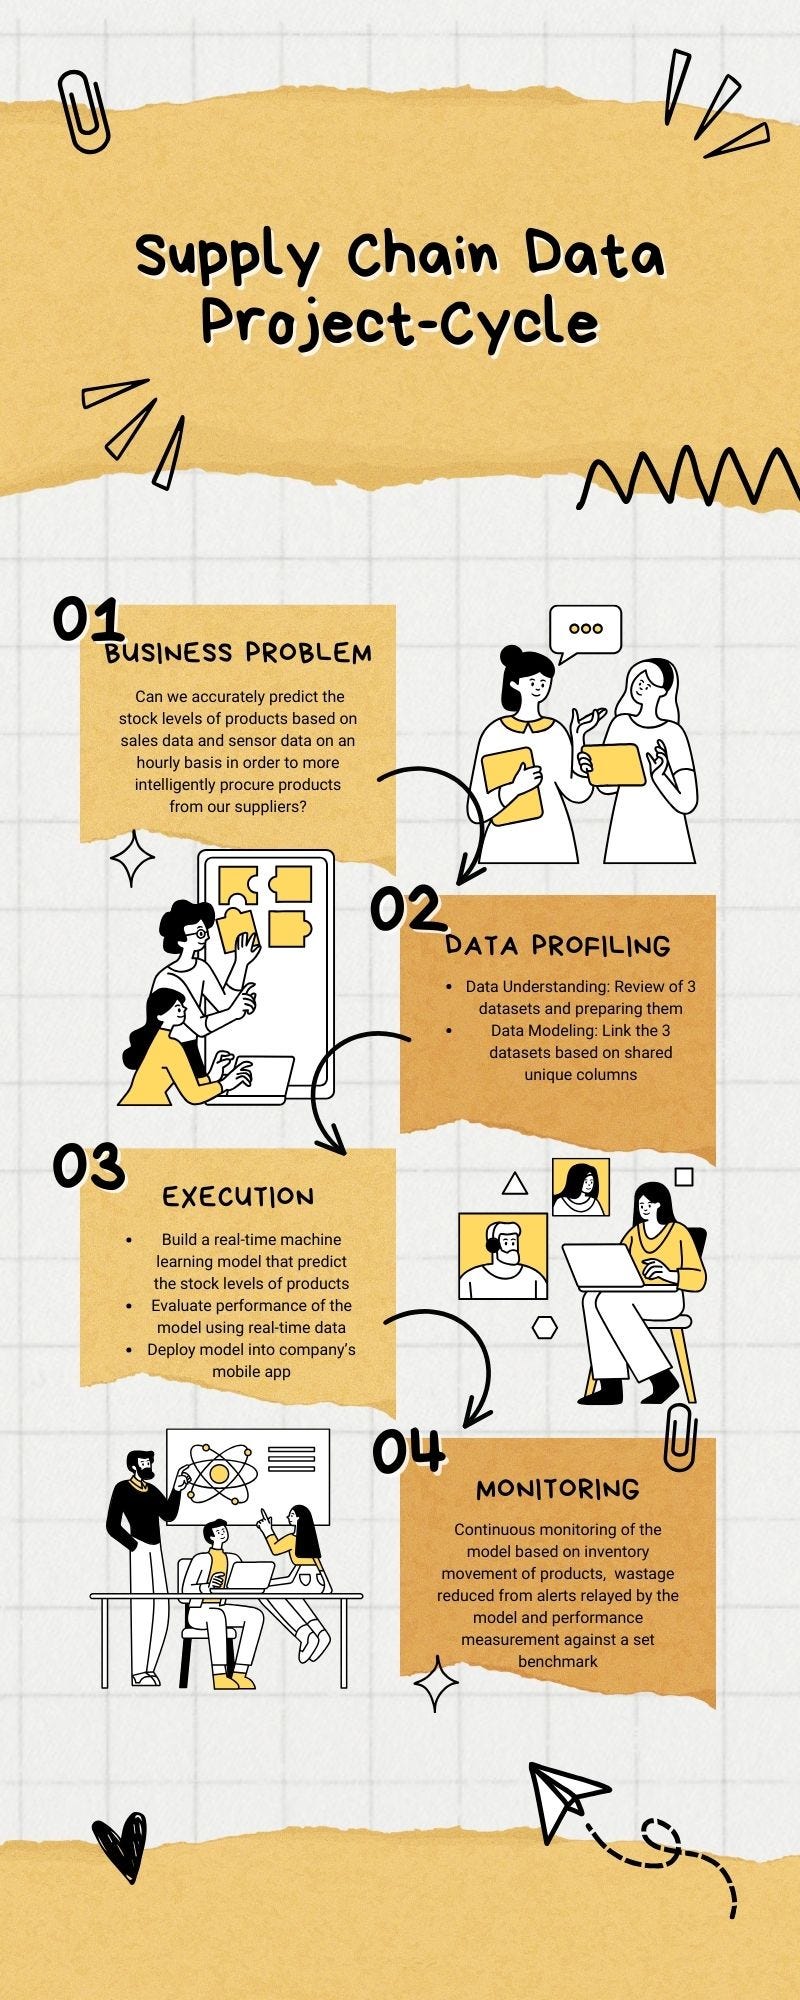
“Can we accurately predict the stock levels of products based on sales data and sensor data on an hourly basis in order to more intelligently procure products from our suppliers?”
The client has agreed to share more data in the form of sensor data. They use sensors to measure temperature storage facilities where products are stored in the warehouse, and they also use stock levels within the refrigerators and freezers in store.
It is your task to look at the data model diagram that has been provided by the Data Engineering team and to decide on what data you’re going to use from the data available. In addition, we need you to create a strategic plan as to how you’ll use this data to complete the work to answer the problem statement.
You can summarize your choices and plan of work in a PowerPoint presentation. This PowerPoint will be sent to the Data Science team leader and the client for a review. Make sure to keep it concise (ideally 1 slide) and business-friendly.
Task’s Significance
The key lessons and skills derived from executing the task include:
Develop an understanding of relational data
Framing a problem statement
Framing a data problem based on business problem
Designing a strategic plan of using relevant data that answers the business problem
Task Execution
Step 1: Data modeling
Look at the data model provided in the additional resources. Look at all the data that is now available from the client and decide what you want to use for the modeling of the problem statement.
Step 2: Strategic planning
Come up with a plan as to how you’ll use this data to solve the problem statement that the client has positioned. This plan will be used to describe to the client how we are planning to complete the remaining work and to build trust with the client as a domain expert. If you need some guidance, use the provided resource video that describes the high-level overview of a data science project.
Step 3: Communication
Summarize the data that you want to make use of and the strategic plan of action in a single PowerPoint slide. This will be sent to the Data Science team leader and the client, so be sure to be concise and use business-friendly language.
Task Output
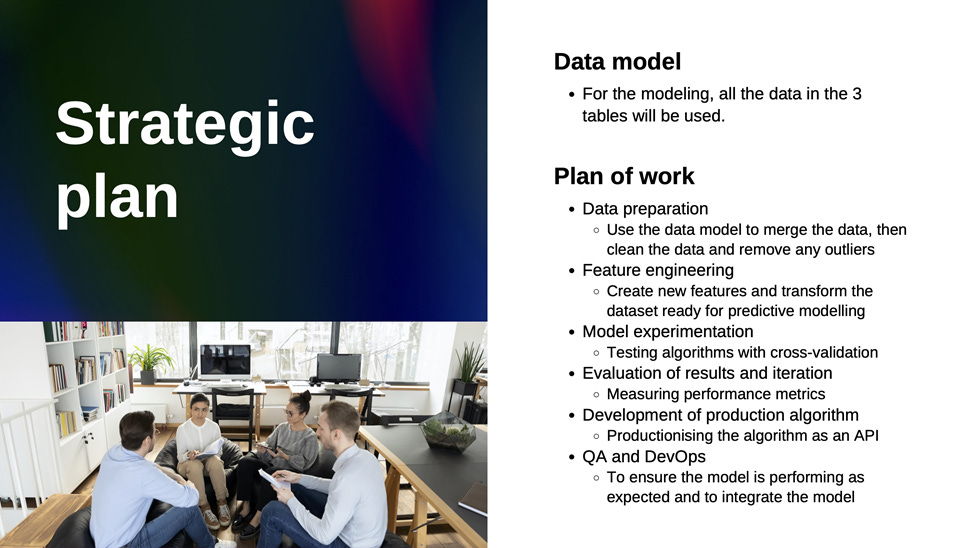
Based on the input of the data model provided and guidance from Data science lifecycle, here’s my strategic plan output depicted below as an image extracted from powerpoint:
The version crafted by an expert from Cognizant (Task answer) is shown below:
Model Building and Interpretation
Task Background
It is now time to get started with some machine learning!
The client has provided 3 datasets, it is now your job to combine, transform and model these datasets in a suitable way to answer the problem statement that the business has requested.
Most importantly, once the modeling process is complete, we need you to communicate your work and analysis in the form of a single PowerPoint slide, so that we can present the results back to the business. The key here is to use business-friendly language and to explain your results in a way that the business will understand. For example, ensure that when you’re summarizing the performance of the results you don’t use technical metrics, but rather convert it into numbers that they’ll understand.
Task’s Significance
The key lessons and skills derived from executing the task include:
Building a predictive model using sampled data
Communicating the key points of machine learning process used in building the model
Task Execution
You have previously outlined the strategic plan for completing the modeling work based on the problem statement.
It is now time for you to deliver on this strategic plan. Some additional resources have been provided to help you with this task. If you feel comfortable enough to complete this task on your own, use the “modeling.ipynb” Python notebook to get started. However, if you’re not sure where to start and would like to be guided through the modeling process, use the “modeling_walkthrough.ipynb” notebook.
Feel free to use these notebooks in a similar way that we did before, using Google Colab. If you prefer to use them within your own development environment, that’s fine too.
The modeling process should take 35-45 minutes.
Once you’re done with the modeling, summarize your results in a business-friendly single PowerPoint slide. Be sure to explain whether this model can help them to tackle the problem statement.
Task Output
Based on the 3 sample datasets used, the insights of the predictive model used to predict hourly stock levels of Gala Groceries’ products is shown in the visual below:
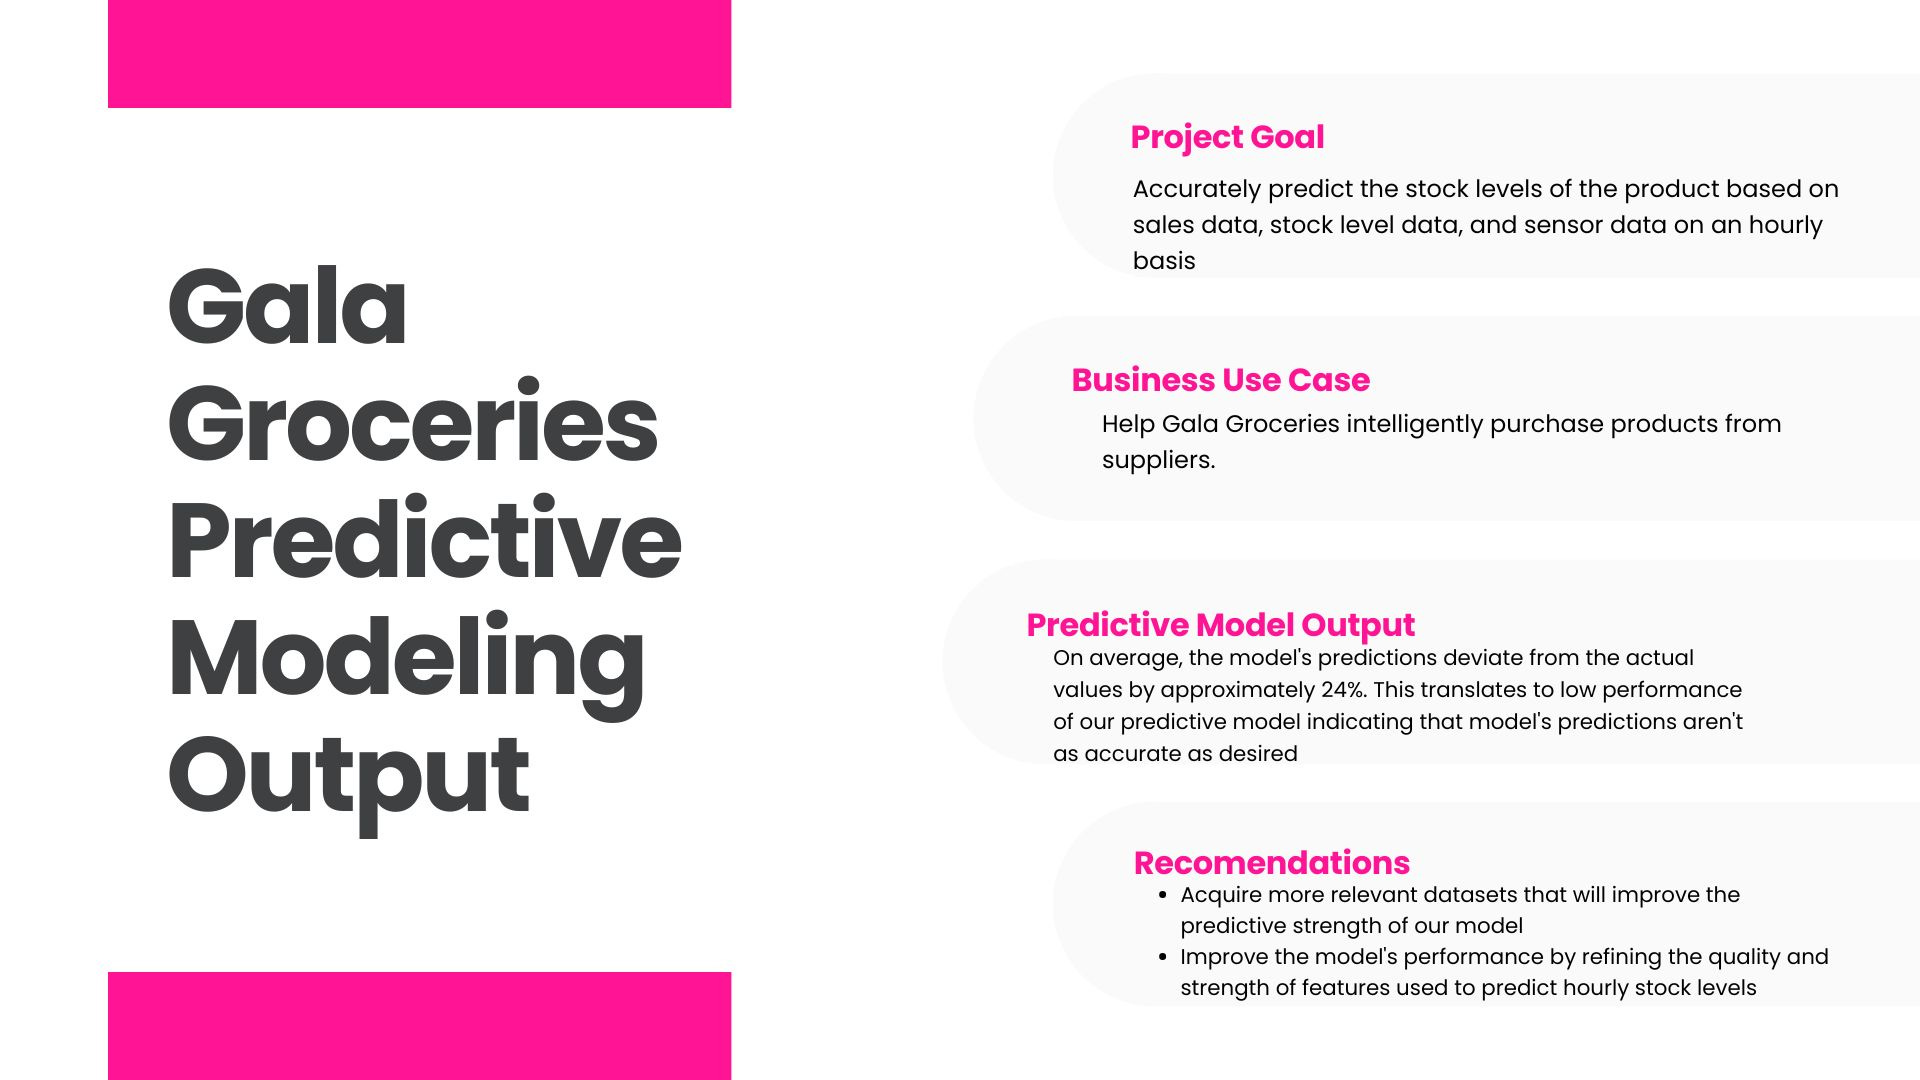
The version crafted by an expert from Cognizant (Task answer) is shown below:
Machine Learning Production
Task Background
Gala Groceries saw the results of the machine learning model as promising and believe that with more data and time, it can add real value to the business.
To build the foundation for this machine learning use case, they want to implement a first version of the algorithm into production. In the current state, as a Python notebook, this is not suitable to productionize a machine learning model. Therefore, as the Data Scientist that created this algorithm, it is your job to prepare a Python module that contains code to train a model and output the performance metrics when the file is run.
Task’s Significance
The key lessons and skills derived from executing the task include:
Best practices for good quality code, including how to structure and handover a Python module
How to develop machine learning algorithms for production
Task Execution
Additional information about Python modules and running Python files is provided in the additional resources. You can assume for this task that the Python file does not need to process, clean or transform the dataset. The Python file should be able to load a CSV file into a data frame, then immediately start training on that data. Assume that the CSV file will contain the same columns as the dataset that you trained the model on in the previous task.
Be sure to write good quality code, this means following best practices and writing your code in a clear and uniform manner. More information about best practices are provided in the additional resources. Furthermore, make sure to document your code with comments, as this will help the ML engineering team to understand what you’ve written.
Step 1: Plan
Good quality code should be planned and should follow a uniform and clear structure. Before you start writing the Python module, take some time to think about how you want to structure this file and what needs to be included from your notebook. It is your choice whether you’d rather write it all in 1 block, separate it out into functions, or create a class with methods. Depending on your ability with coding, you may take a different approach. A starter file “module_starter.py” is provided, which gives some hints as to how you may want to structure the file. If you’re a beginner, you may also want to make use of the file named “module_helper.py”, which includes some functions that you may want to make use of. If you do use this helper file, you can simply copy and paste the functions that you would like to use into the module that you’re writing.
Step 2: Write
After planning the module that you’re going to write, you can start creating your file! Be sure to follow a consistent and clear structure, and use the additional resources for best practices. Also be sure to include plenty of comments and documentation, because the ML engineering team is not the team that wrote this code. Remember, you can assume that the Python file does not need to process, clean or transform the dataset. You can load the Python file as a CSV file directly into a data frame, and then immediately start training on that data. Assume that the CSV file will contain the same columns as the dataset that you trained the model on in the previous task.
Task Output
A python module that adheres to the following structured template:
Importing Packages: Import necessary libraries at the beginning of the file.
Define Global Constants: Define any constants that will be used throughout the module. These constants should be named in all uppercase.
Algorithm Code: Define functions for loading data, preprocessing, and training the algorithm. Each function should have a clear purpose and be relatively independent.
Main Function: Define a main function that orchestrates the entire pipeline, from loading data to training the model.
The python module has been hosted on my Github account. It can be accessed via the following link: stock_prediction_module.
Summarized Insights & Recommendations
Gala Groceries implementation of machine learning prediction model resulted in various insights. They include:
Majority of Gala Groceries’ consumers (About 26%) use cash as forms of payment
Non-member customers represent the largest category of customers, leading by a margin of 20.5%
Fruit and vegetables were the two most purchased items
Predicting hourly stock levels of the company’s products required relating sales data with sensory temperature data and stock levels data
On average, the machine learning model's predictions deviate from the actual values by approximately 24%. This translates to low performance of the machine learning predictive model indicating that model's predictions aren't as accurate as desired.
The prediction error also means that if the prediction model was to be incorporated into the company’s system as an API or Mobile app, a 24% deviation could mean the company either overstocks or understocks products by 24%. Overstocking leads to increased holding costs and potential wastage, especially for perishable items. Understocking, on the other hand, could lead to missed sales opportunities and unsatisfied customers.
Recommendations
Key recommendations Gala Groceries can adopt in order to accurately predict the stock levels of products based on the predictive model’s output:
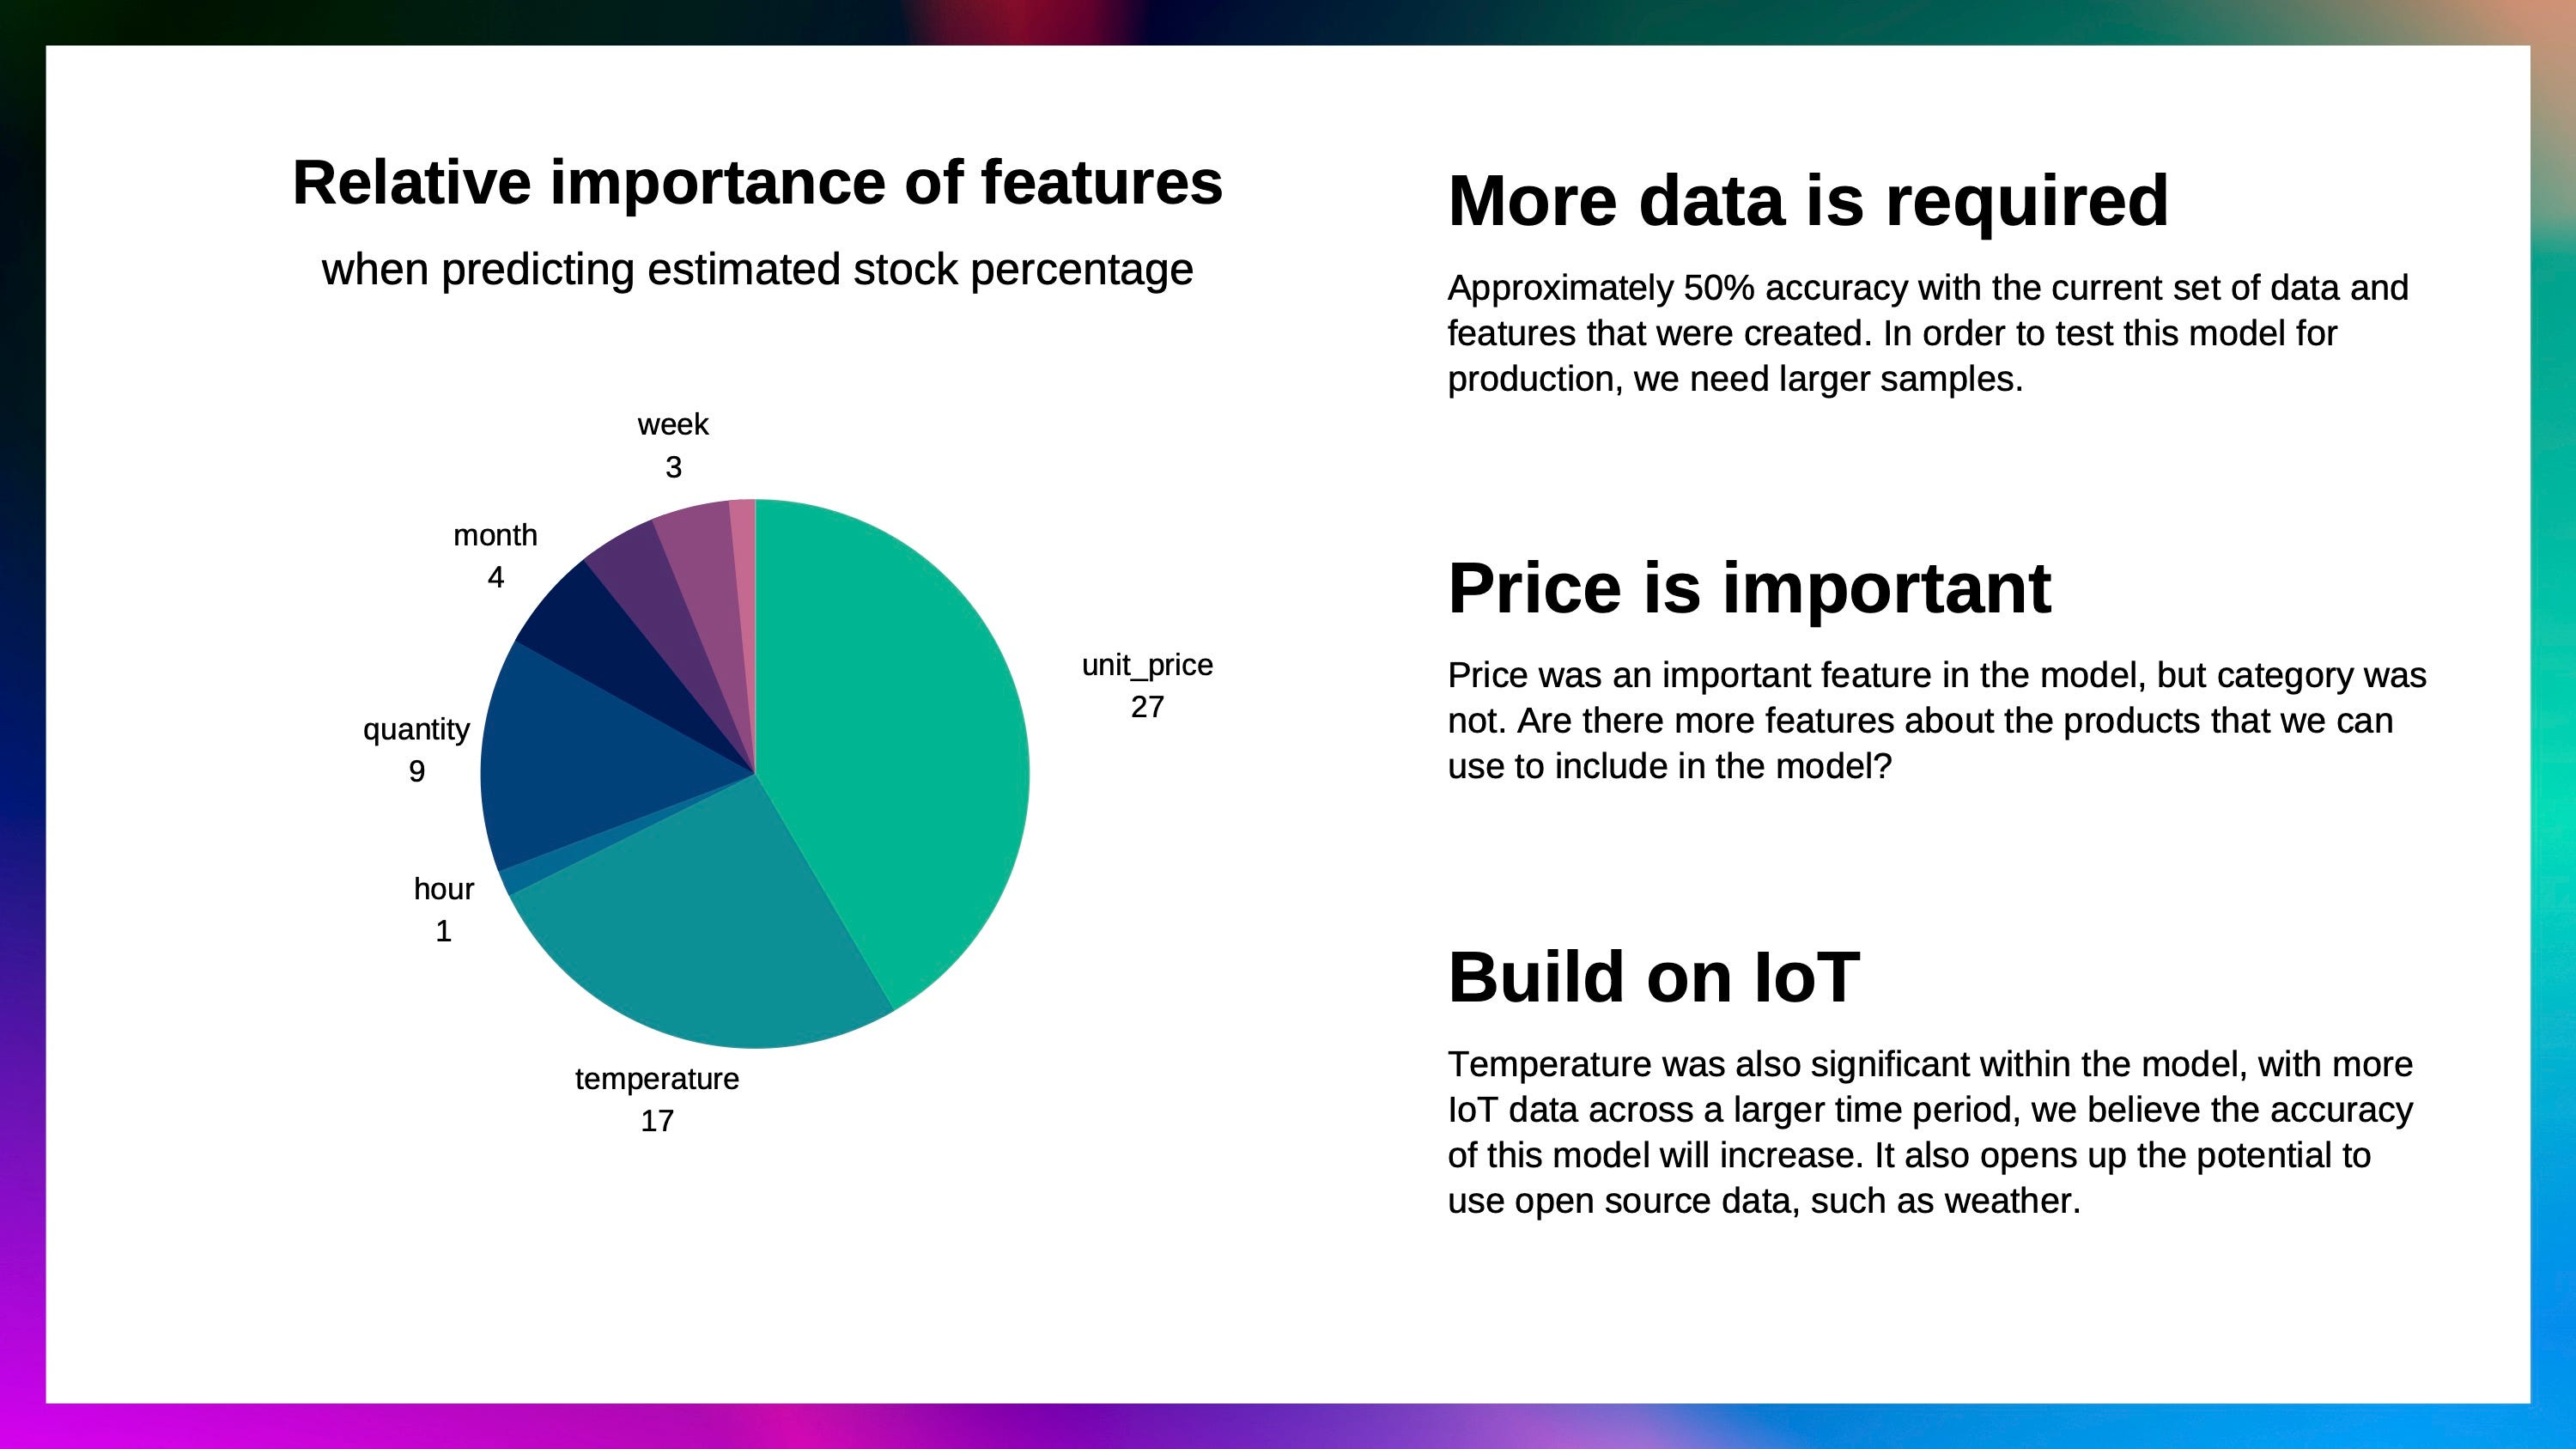
Improve the quality of the input data in terms of predictive strength of features used by the model and increase the volume of training data
Acquire more relevant datasets that will improve the predictive strength of our model. Examples of datasets that can be used: weather data and deliveries (stock delivery) data. Additional features from the two datasets would improve the general accuracy and performance of the predictive model; weather patterns affect delivery times of stocks thus affecting the accuracy of stock levels hed by the company.
Train the relevant datasets on other complex machine learning models to compare performance
Consistent monitoring and quality assurance is required to improve the machine learning predictions’ accuracy before and after deploying it into the company’s operations.
Resources:
Technical analysis was done using Python language in a jupyter notebook. Feel free to review the work hosted on my Github account.
Link: Cognizant Artificial Intelligence Project
Thank you for your time and patience. I hope you learnt something new.